The Genius Behind One of History's Best Data Visualizations
Charles Joseph Minard’s 1869 graphic visualizes Napoleon’s doomed march into Russia and is frequently cited as “the best statistical graphic ever drawn” by masters of visualization such as Edward Tufte. It embodies the primary goal of data visualization: To show and explain complex data clearly and efficiently.
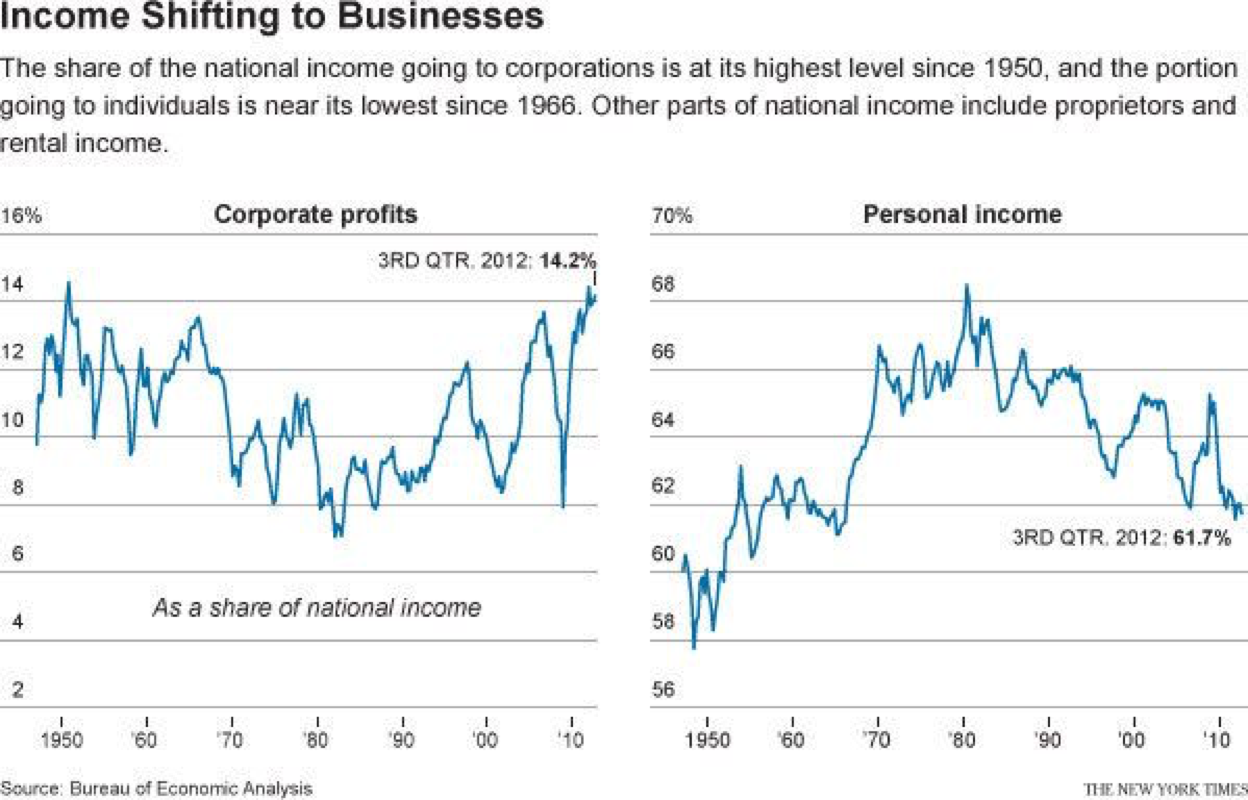
The data set contains six degrees of data: the size of Napoleon’s army, the direction the army is traveling, time, longitude, latitude, and, at the bottom, temperature. Most graphs found today are simple bivariate data sets with one of the variables usually being time, as shown in the New York Times graphic.
Minard expertly combines the complex set of data into one comprehensive and exhaustively illustrative graphic. By Minard’s estimation, 10,000 soldiers in Napoleon’s army returned out of the original 422,000. He allows for a clear comparison between the beginning and end size of the army by stacking their respective colors (Gold and Black) on top of one another, as shown in the snippet from the graph below.
Minard demonstrates his knowledge of color theory when he chooses bright gold as the color to represent the army approaching Russia. Humans quickly catch sight of bright colors and a viewer’s eyes will immediately be drawn to the army in bright gold. Minard subtly guides the viewer through his graphic in the order he intended. In contrast, he chooses the color black to represent the returning army, which leaves no room for confusion. Both colors, overlaid on the white background, also produce crisp edges and detail necessary for the viewer to clearly see the decimation of Napoleon’s Army. The result is so intuitive that Minard feels no need to include a legend. I made that simple mistake in the heatmap below for the probability of landing on each Monopoly space.
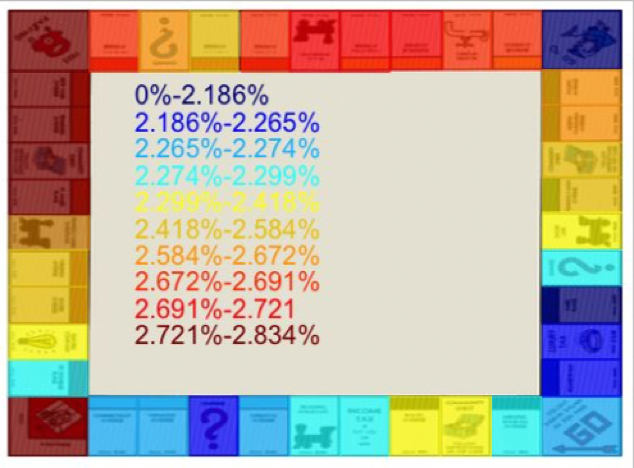
Notice how the oversaturated colors are visually abrasive. High color saturation blurs the difference between similar colors (eg. orange and yellow on the right side).
Tufte is a vocal proponent of the data visualization maxim “Strive for a high datatoink ratio”. What he means is there are so many needless artistic flourishes or visual aids that only add confusion and hide what the data is really trying to express. The best graph is a simple graph. Compare the two pie charts below, visualizing the allocation of a family’s budget during the early 20th century.
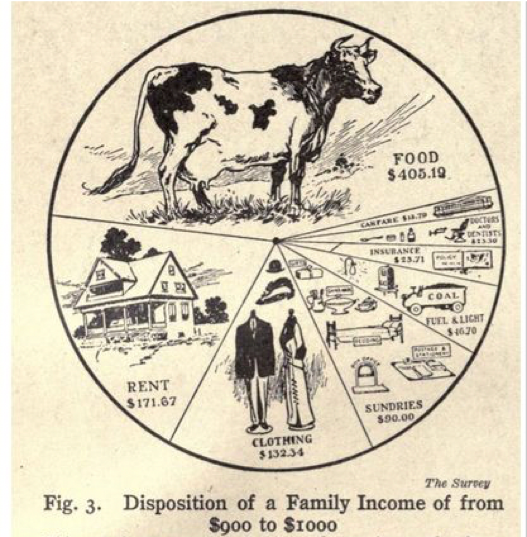
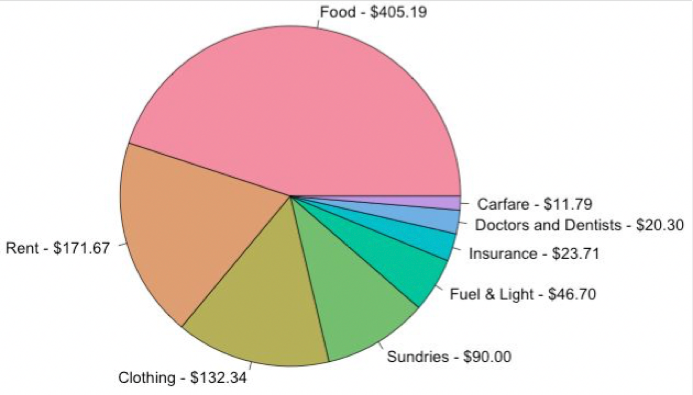
The pie chart that includes drawings suffers from a overcomplexity. Viewers might compare the size of the images in each piece of the pie rather than the angle of each peice. The other pie is a clearer example that displays the data with no frills.
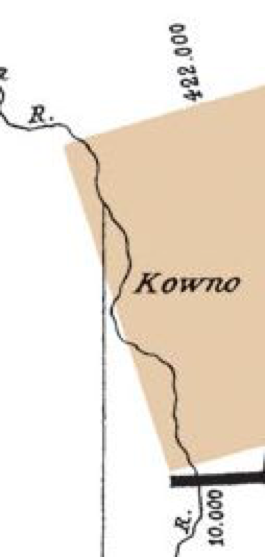
Minard could have included every lake, river, town, and city in his masterpiece. Instead he opted to include only the most essential cities and rivers in order to remove distractions from the main objective of his visualization. In this snippet of the visualization, the viewer immediately knows that there was a battle near the Moskowa river that resulted in 27,000 casualties.
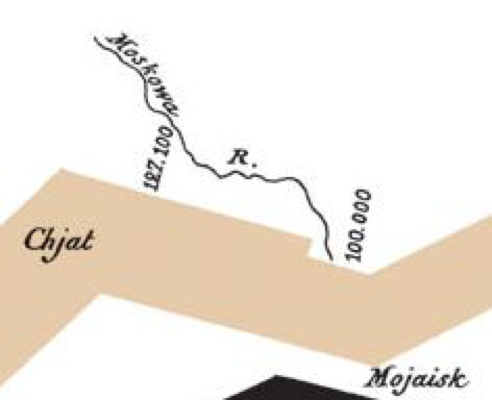
This battle is in fact the bloodiest of the campaign, the Battle of Borodino, where over 75,000 men died. He could have included the many other surrounding towns and rivers but that would only serve to distract.
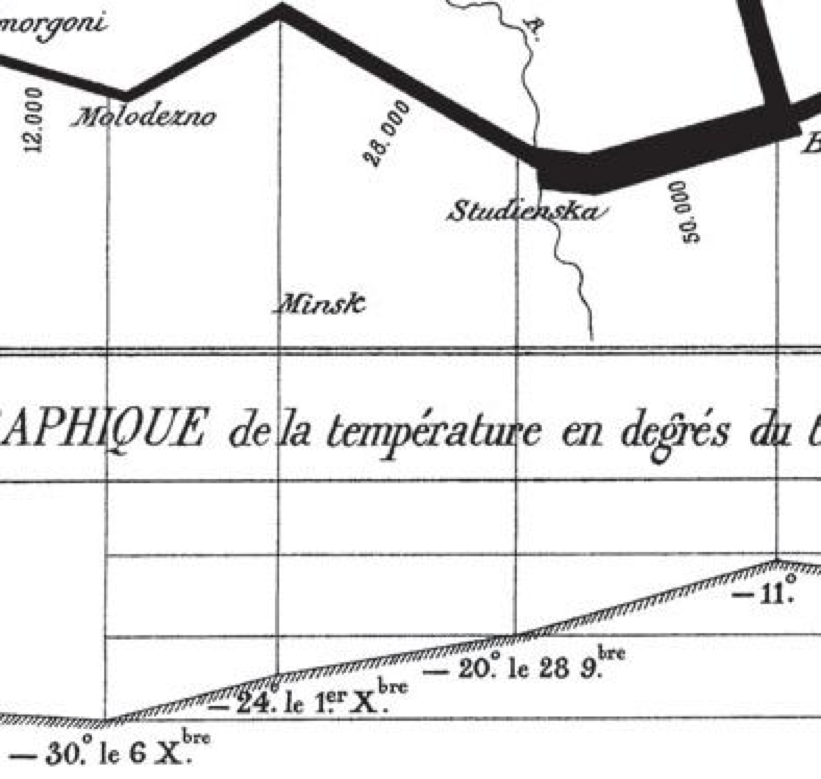
The most powerful, yet subtle, use of data visualization techniques Minard employs is causality between two variables. He links the declining temperature on Napoleon’s retreat with casualties among Napoleon’s army.
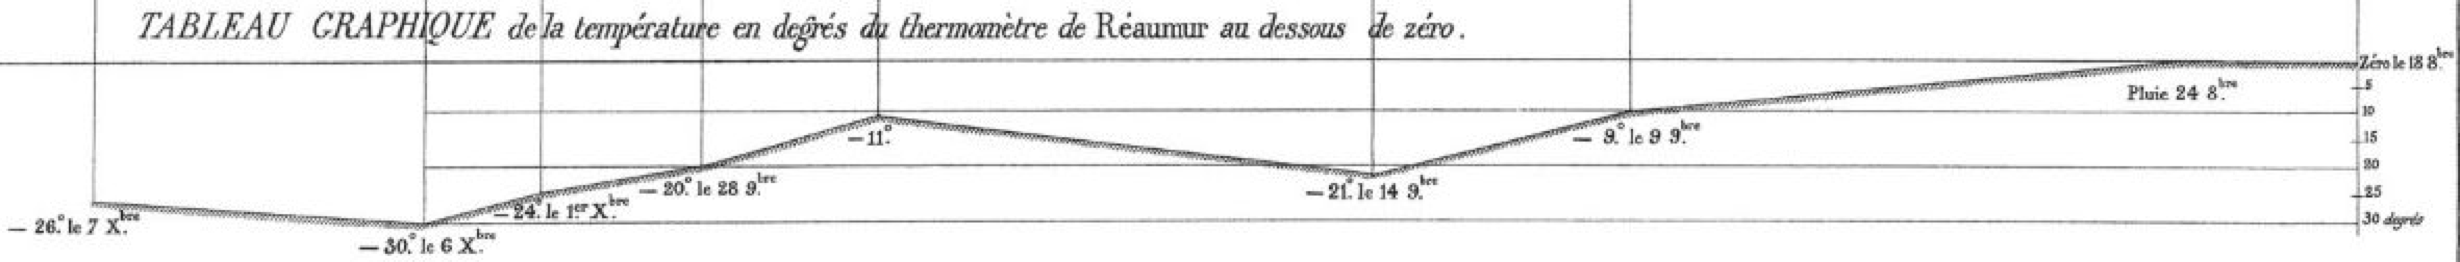
Minard draws a simple bivariate line graph showing change in temperature over change in time (if Tufte’s words were taken to their utmost extreme then one could argue the axis marks could be removed). Minard cleverly links those data points to geographic locations with lightlydrawn lines so as to suggest a link rather than demanding the viewer recognize it.
Any person can view this graphic and immediately understand its message. The graph is easily accessible so viewers who have no prior knowledge of the subject matter can take away a great deal of information with minimal effort. His creativity and skill make this graph the exemplar of data visualization even after more than a century.